
In Japan, property prices are decided by both land and buildings value. Although there is a tendency that the value of building decreases with increasing building age, the land value might not go in the same way.
This article will show the most updated land value in Tokyo and the change in 5 years. The land value is one of the key factors affecting the overall property price in Tokyo. The value trend might hint at where there is potential for property investment in Tokyo, especially within the 23 special wards.
■ Overall Land Value in Tokyo
According to the data from the Ministry of Land, Infrastructure, Transport and Tourism, the land value per square meter for both commercial and residential use in 2022 is as follows:
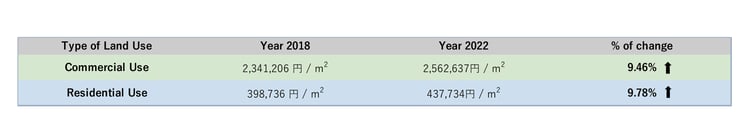
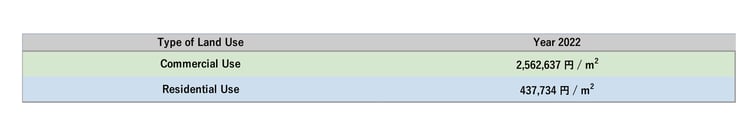 As compared with the land value in 2018 shown below, the land value for commercial use has increased by 9.46% while that for residential use has grown by 9.78% during the past 5 years.
The graphs below show the change rate of each year from 2018 to 2022. Before the prevalence of COVID-19, both commercial and residential land had a significant increase each year. However, with the influence of COVID-19, the growth rate of the land value of both commercial and residential use has slumped to a negative rate in 2021. This is pretty clear in commercial land value, which fell from 6.48% in 2020 to -3.18% in 2021 and remains negative this year with a narrowed range. The land value of commercial use is still lower than that was in 2020.
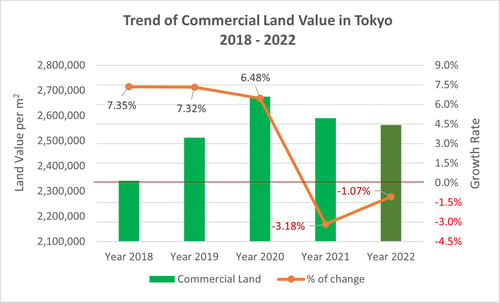
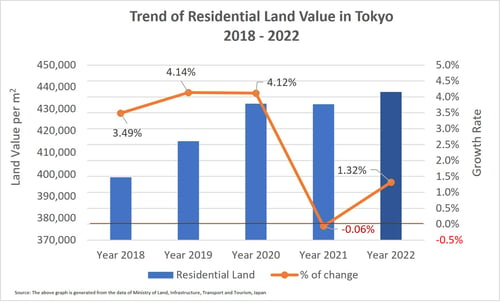
Although the tendency is similar for residential land value, with a growth rate that fell from 4.14% in 2020 to -0.06% in 2021, it turned to a positive growth rate of 1.32% this year and topped the value in 5 years.
■ Land value in 23 special wards of Tokyo
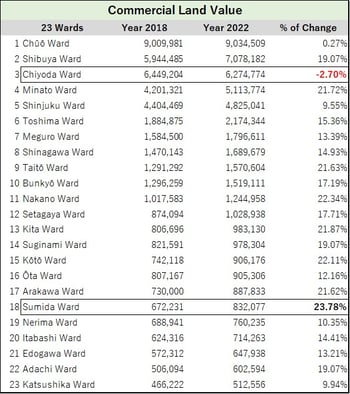
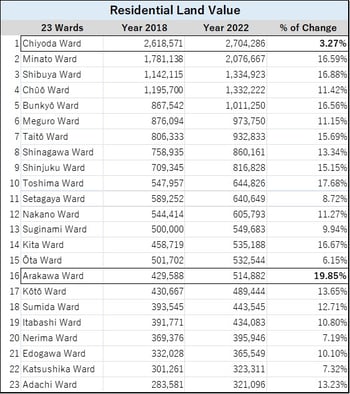
If one is planning to invest in property within the 23 special wards of Tokyo, it is best to understand the change in land value in the past few years when considering the location, as land value is one of the key factors affecting the overall property price. The tables below show the rankings of both commercial and residential land values in Tokyo 23 wards in 2018 and 2022 and the growth rate in the past 5 years.
 |
 |
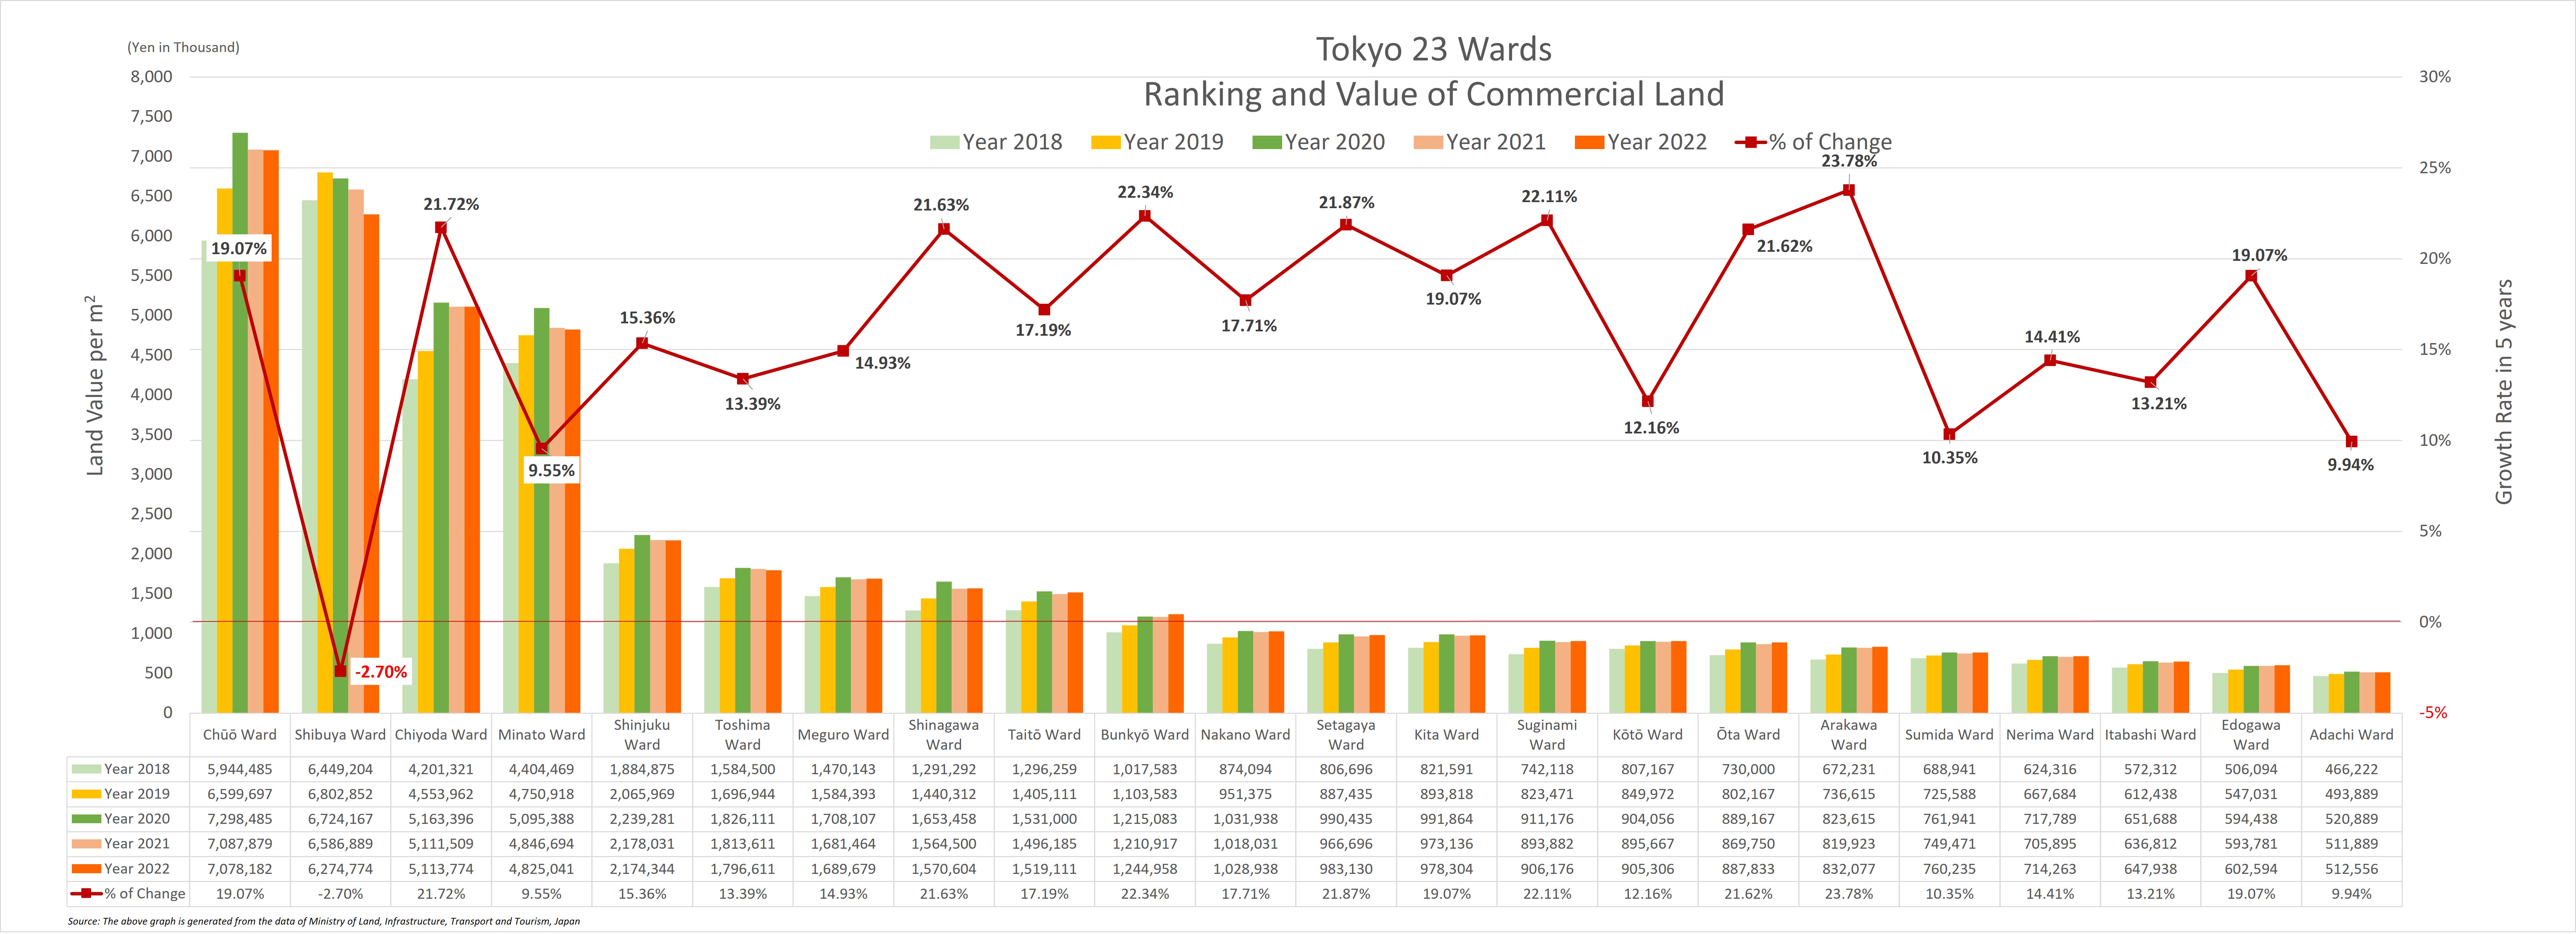
The graphics below show more details with the trend of the land value change in the past 5 years for both commercial and residential use.
For commercial land value in 2022, Chuo Ward topped the ranking with 9,034,509 yen per sqm while the lowest one was Katsushika Ward with 512,556 yen per sqm, just around 5.7% of that of Chuo Ward. In the past 5 years, Sumida Ward got the highest growth rate of 23.78% while the lowest one is Chiyoda Ward which has a negative growth rate of -2.7%. Other than Chuo Ward, Chiyoda Ward, Shinjuku Ward and Katsushika Ward, the rest of 23 special wards in Tokyo have a 2-digit growth rate.
*For enlargement, please click the graphic below.
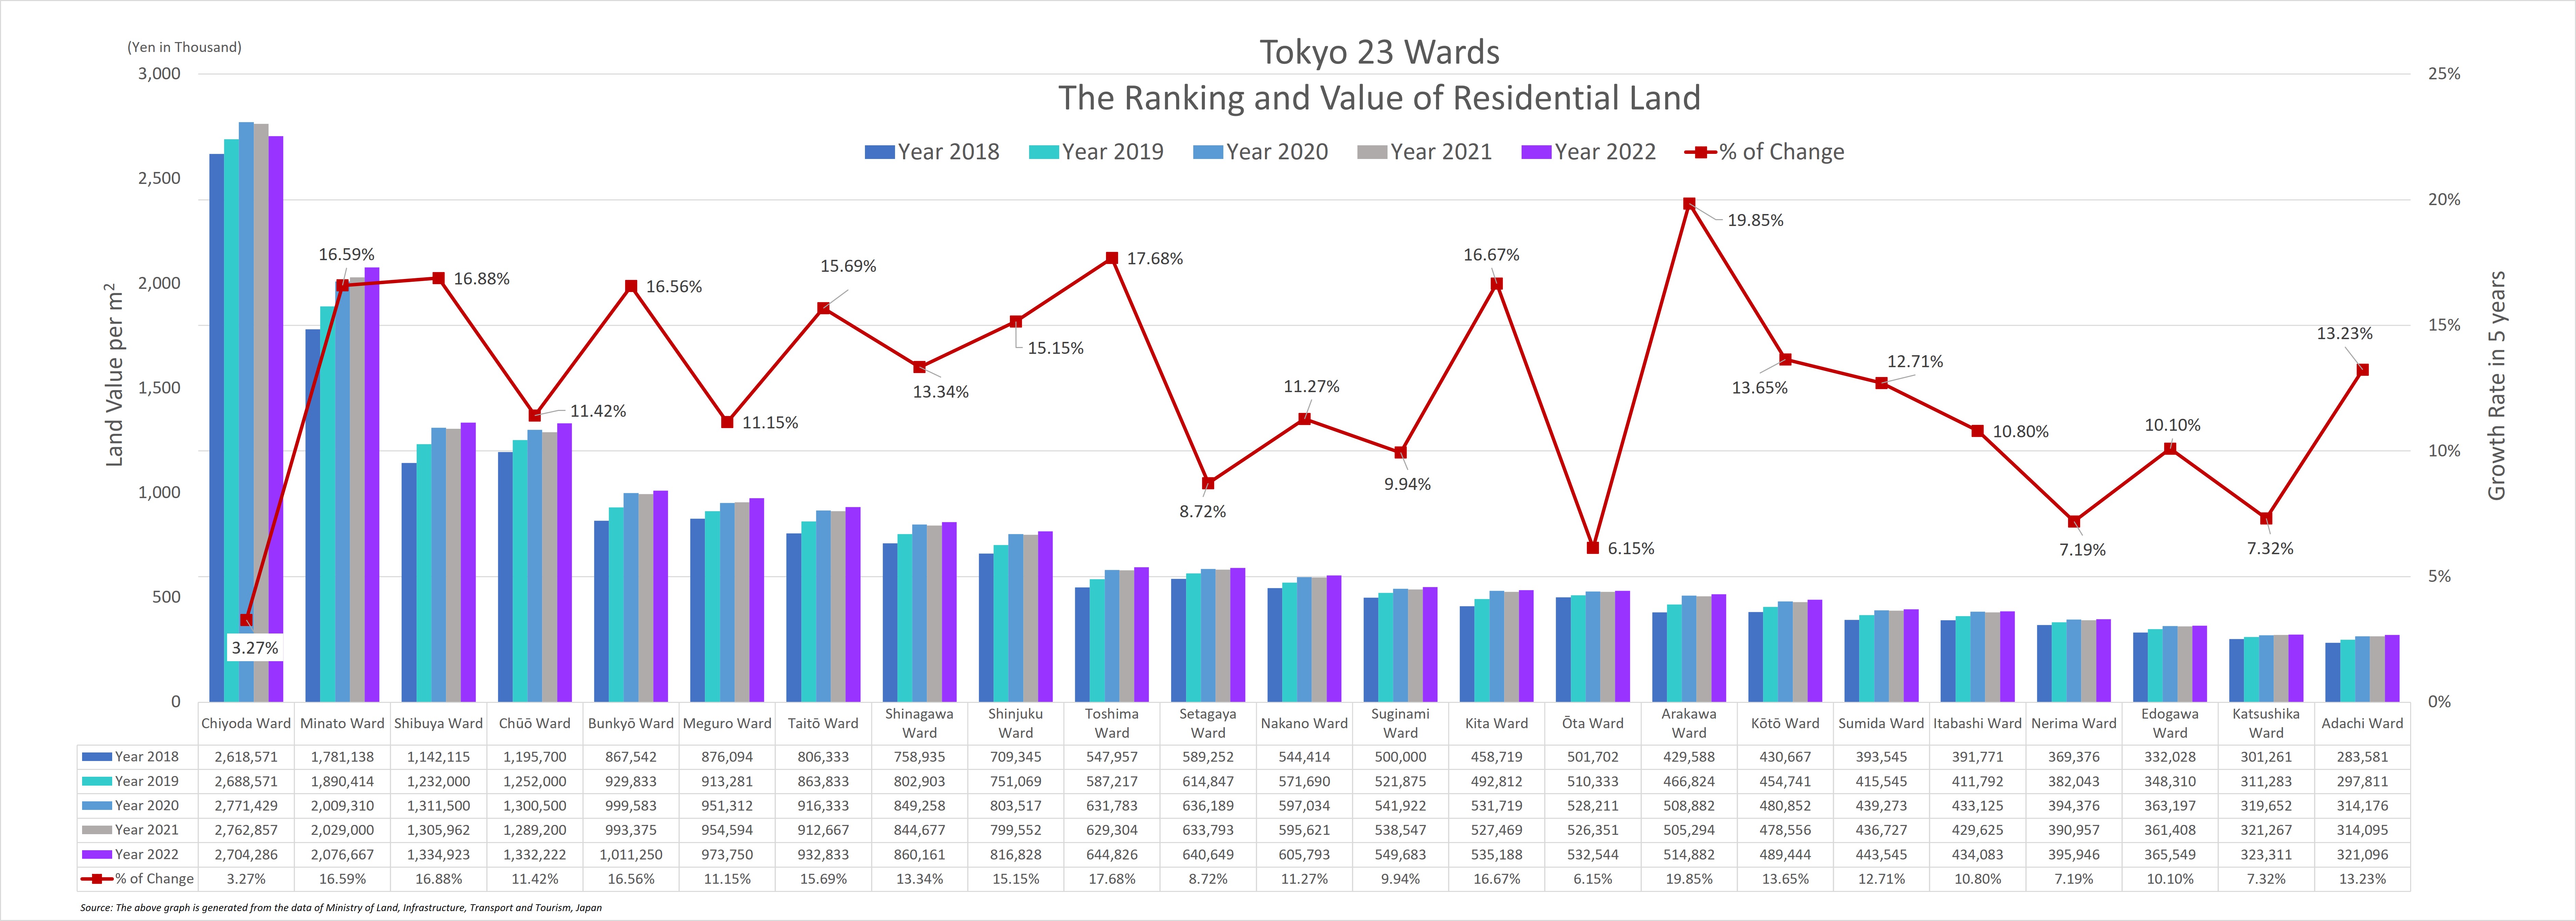
For residential land value in 2022, Chiyoda Ward ranked at the top with 2,704,286 yen per sqm, followed by Toshima Ward and Shibuya Ward with a growth rate of 17.68% and 16.88% respectively. The one with the lowest value is Adachi Ward, with 321,096 yen per sqm, just around 11.87% of that of Chiyoda Ward. In the past 5 years, Arakawa Ward got the highest growth rate of 19.85% while the lowest one was Chiyoda Ward with a growth rate of 3.27%. Other than Chuo Ward, Chiyoda Ward, Shinjuku Ward and Katsushika Ward, the rest of 23 special wards in Tokyo have a 2-digit growth rate.
*For enlargement, please click the graphic below.
To sum up, the land value in Tokyo has been raised significantly in the past 5 years. The land value has reached 2,562,637 yen per sqm for commercial use and 437,734 yen per sqm for residential use, and with a growth rate of 9.46% and 9.78% respectively. For the land value in the 23 special wards of Tokyo, most of the wards have a 2-digit growth rate, with Sumida Ward grabbing the top growth rate of 23.78% in commercial land and Arakawa Ward topping the growth rate of 19.85% for residential land.
※Source: All the above tables and graphics are generated from the data of the Ministry of Land, Infrastructure, Transport and Tourism, Japan.
If you would like to learn more about property investment in Japan, please click here. >
You might have interest to read the following articles as well:
NEW OR OLD? Which one is better for property investment in Japan?
Why Reinforced Concrete (RC) Residential Building is good for long-term investment?.
What are the costs incurred when buying a property in Japan?.
(REF: B-MN-E01