

◆Changes in Land Prices Before and After the COVID-19 Pandemic: What are the Investment Opportunities in the Tokyo Area?◆
Since the outbreak of the COVID-19 pandemic in 2019, the situation seems to have been improved this year. Countries around the world, including Japan, are no longer under lockdown and are re-opening their borders for overseas travelers. The global economy also appears to have rebounded. It is time to review the tendency of land prices in Japan that have been affected by the COVID-19 pandemic in the past few years.
There is always a paradox among overseas investors that the room for property price growth in Japan is very limited, which favors investments with income gains instead of capital gains. Although it is a fact that the value of buildings might tend to decrease over time, the land price could vary depending on its location and economic conditions. Since the property price is evaluated by the value of both land and buildings, the possibility of the price growing cannot be underestimated. While one might assume that Japan's economy has been adversely affected by the COVID-19 pandemic, which might have dragged down the land price in the past few years, the latest land value data released by the Ministry of Land, Infrastructure, Transport, and Tourism of Japan might give you another answer.
This article will provide a brief analysis of the change in land prices in Japan in the past four years. After a general review of the overall changes in land prices throughout Japan, the analysis will be shifted to the capital area of Tokyo, which includes Tokyo, Chiba Prefecture, Saitama Prefecture, and Kanagawa Prefecture. Lastly, the focus will be on analyzing the trends in land prices in the 23 wards of Tokyo, which give insights on the tendency of land prices in Tokyo and the surrounding prefectures.
■ Trends in Land Prices of the overall land purposes in Japan
According to a recent land price report released by the Ministry of Land, Infrastructure, Transport, and Tourism in Japan, there is a 1.6% year-on-year growth in the average land price for overall land purposes in 2023. While the pre-pandemic growth rate was 1.4% in 2020, it sharply dropped to -0.5% in 2021 with the effect of COVID-19. The rate returned to 0.6% growth in 2022, finally surpassing the figures in 2020 with a growth of 1.6% this year. For the price change rate of residential land, there is a significant increase of 1.4%, which is far exceeding the growth of 0.8% in 2020. For the price change rate of commercial land, there is also an increase of 1.8%, though the figure is just about half of that in 2020. This implies that commercial land prices have not yet returned to pre-pandemic levels.
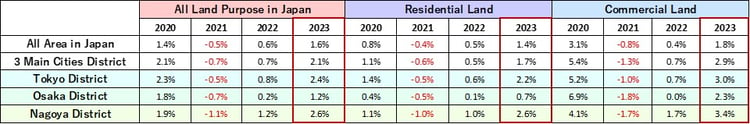
Other than the overall land price change in Japan, the change rate of the three major city districts, including Tokyo district, Osaka district, and Nagoya district, can also be seen from the above table. Among the three major city districts, Nagoya has the highest year-on-year increase of 2.6%. Both residential and commercial land prices have also shown high increases, with average growth rates of 2.6% and 3.4% respectively, which surpassing the figures in 2020.
As for the Tokyo district, the overall average increase in land prices is 2.4%, slightly lower than that of the Nagoya district. The average increase in residential and commercial land prices in the Tokyo district is 2.2% and 3.0% respectively, with the residential one surpassing the figures in 2020. Out of the three city districts, the Osaka district has the least growth in land prices, with an average increase of only 1.2%.
■ Trends in Land Prices in Tokyo district areas
After reviewing the overall land price trends in Japan, the analysis focus will be shifted to the residential and commercial land of the Tokyo district area, which includes the capital - Tokyo, and the 3 surrounding prefectures: Chiba Prefecture, Saitama Prefecture, and Kanagawa Prefecture during the pre- and post-pandemic periods.
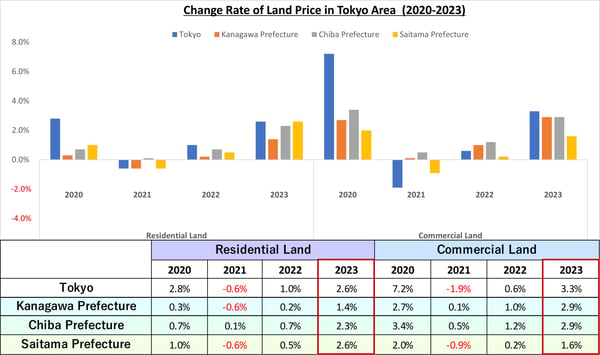
From the chart below, it is easy to discover that both residential and commercial land prices in all Tokyo district areas experienced growth in 2020. The highest increase was seen in commercial land in Tokyo, reaching a significant growth rate of 7.2%. On the other hand, residential land in Kanagawa prefecture had the lowest increase, with only a 0.3% rise. In the following year, 2021, the effect of COVID-19 was noticeable, and almost all the Tokyo district areas had been affected. Except for the slight growth in commercial land in Chiba Prefecture and Kanagawa Prefecture, the rest experienced negative growth. The commercial land price in Tokyo was severely impacted, with a change rate plunging from 7.2% in 2020 to -1.9% in 2021.
In 2023, all the Tokyo district areas appear to have a full recovery. For residential land, all areas except Tokyo have a growth rate higher than that in 2020. For commercial land, other than Kanagawa Prefecture, the growth rate of the rest area is lower than in 2020, implying that commercial land prices have not yet returned to pre-pandemic levels.
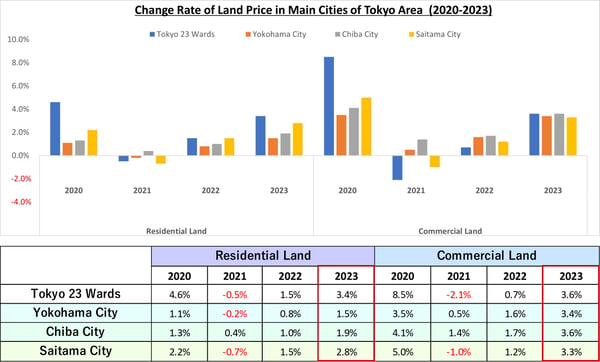
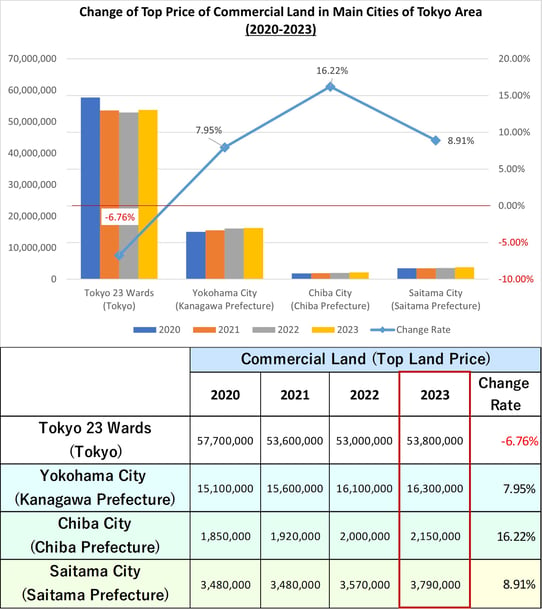
The coming graphic and table will show the year-on-year figure on the price changes of residential and commercial land in the major cities of the Tokyo district areas, including 23 wards of Tokyo, Yokohama City of Kanagawa Prefecture, Chiba City of Chiba Prefecture, and Saitama City of Saitama Prefecture.
Similar to the trends in the above analysis, the 4 major cities experienced good growth in land prices in 2020 prior to the pandemic. This is especially true for commercial land, as all figures are above the prefectures’ overall growth rate. This rate was significantly high in the 23 wards of Tokyo, which recorded a high year-on-year growth rate of 8.5%.
However, with the effect of the pandemic in 2020, 3 cities in residential land price and 2 cities in commercial land price recorded negative growth rates, while the rest got a lower year-on-year rate. Nevertheless, all of the 4 cities are fully recovered in residential land values in 2023, other than the 23 wards of Tokyo, the other 3 cities have a growth rate even higher than that in 2020. This is not reflected in commercial land, as the growth rate of the 4 major cities is still lower than that in 2020. Again, these figures show that it still takes time for commercial land prices to return to pre-pandemic levels.
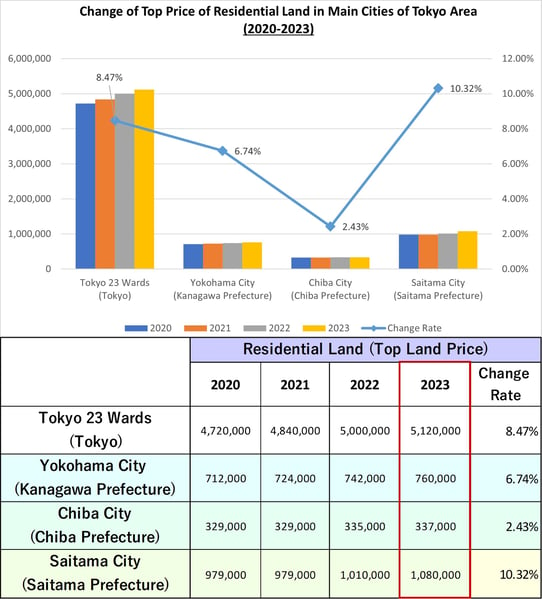
Since the year-on-year change rate cannot reflect the actual price of the land in different areas, the following graphics and tables will show the top price level (per square meter) of both residential land and commercial land among the 4 cities, as well as the change rate over 4-year period.
First of all, the price of residential land in the 23 wards of Tokyo is almost 4 times higher than that of the other 3 cities. The price has increased from 4,720,000 yen in 2020 to 5,120,000 yen in 2023, with a high growth rate of 8.47%, even with the impact of COVID-19 during the past few years. This might be the reason why the price of residential property has continued to rise in central Tokyo in recent years.
Saitama City of Saitama Prefecture has the second position next to 23 wards of Tokyo in terms of price level, but tops the change rate of the 4 cities, with a significant growth rate of 10.32% over the past 4 years. Although its land price stagnated in 2020 and 2021, it suddenly grew from 979,000 yen in 2022 to 1,080,000 yen in 2023. This reveals its potential with the rise of residential property prices in the coming future. Among the 4 cities, Chiba City in Chiba Prefecture has the lowest growth rate of 2.43%, and the lowest price level of 337,000 yen, which is less than one-tenth of that in 23 wards of Tokyo.
Secondly, similar to the case of residential land, the price of residential land in the 23 wards of Tokyo is almost 4 times higher than that of the other 3 cities. However, with the effect of the pandemic, it recorded a negative growth of 6.76% in the past 4 years and have not been able to recover to pre-pandemic levels. It is the only city in the Tokyo district area with negative growth. Additionally, it is surprising to see that Chiba City in Chiba Prefecture achieved a growth rate of 16.22% over the past 4 years, demonstrating its potential on the commercial land value, as this city just takes less than an hour train time to Tokyo Station.
■ Land prices and changes in the 23 wards of Tokyo
The 23 wards of Tokyo are the central area with the highest concentration of population in Tokyo, and overall land prices are higher than the surrounding areas. Understanding the changes and rankings of land prices in each ward may help in choosing potential properties for investment.
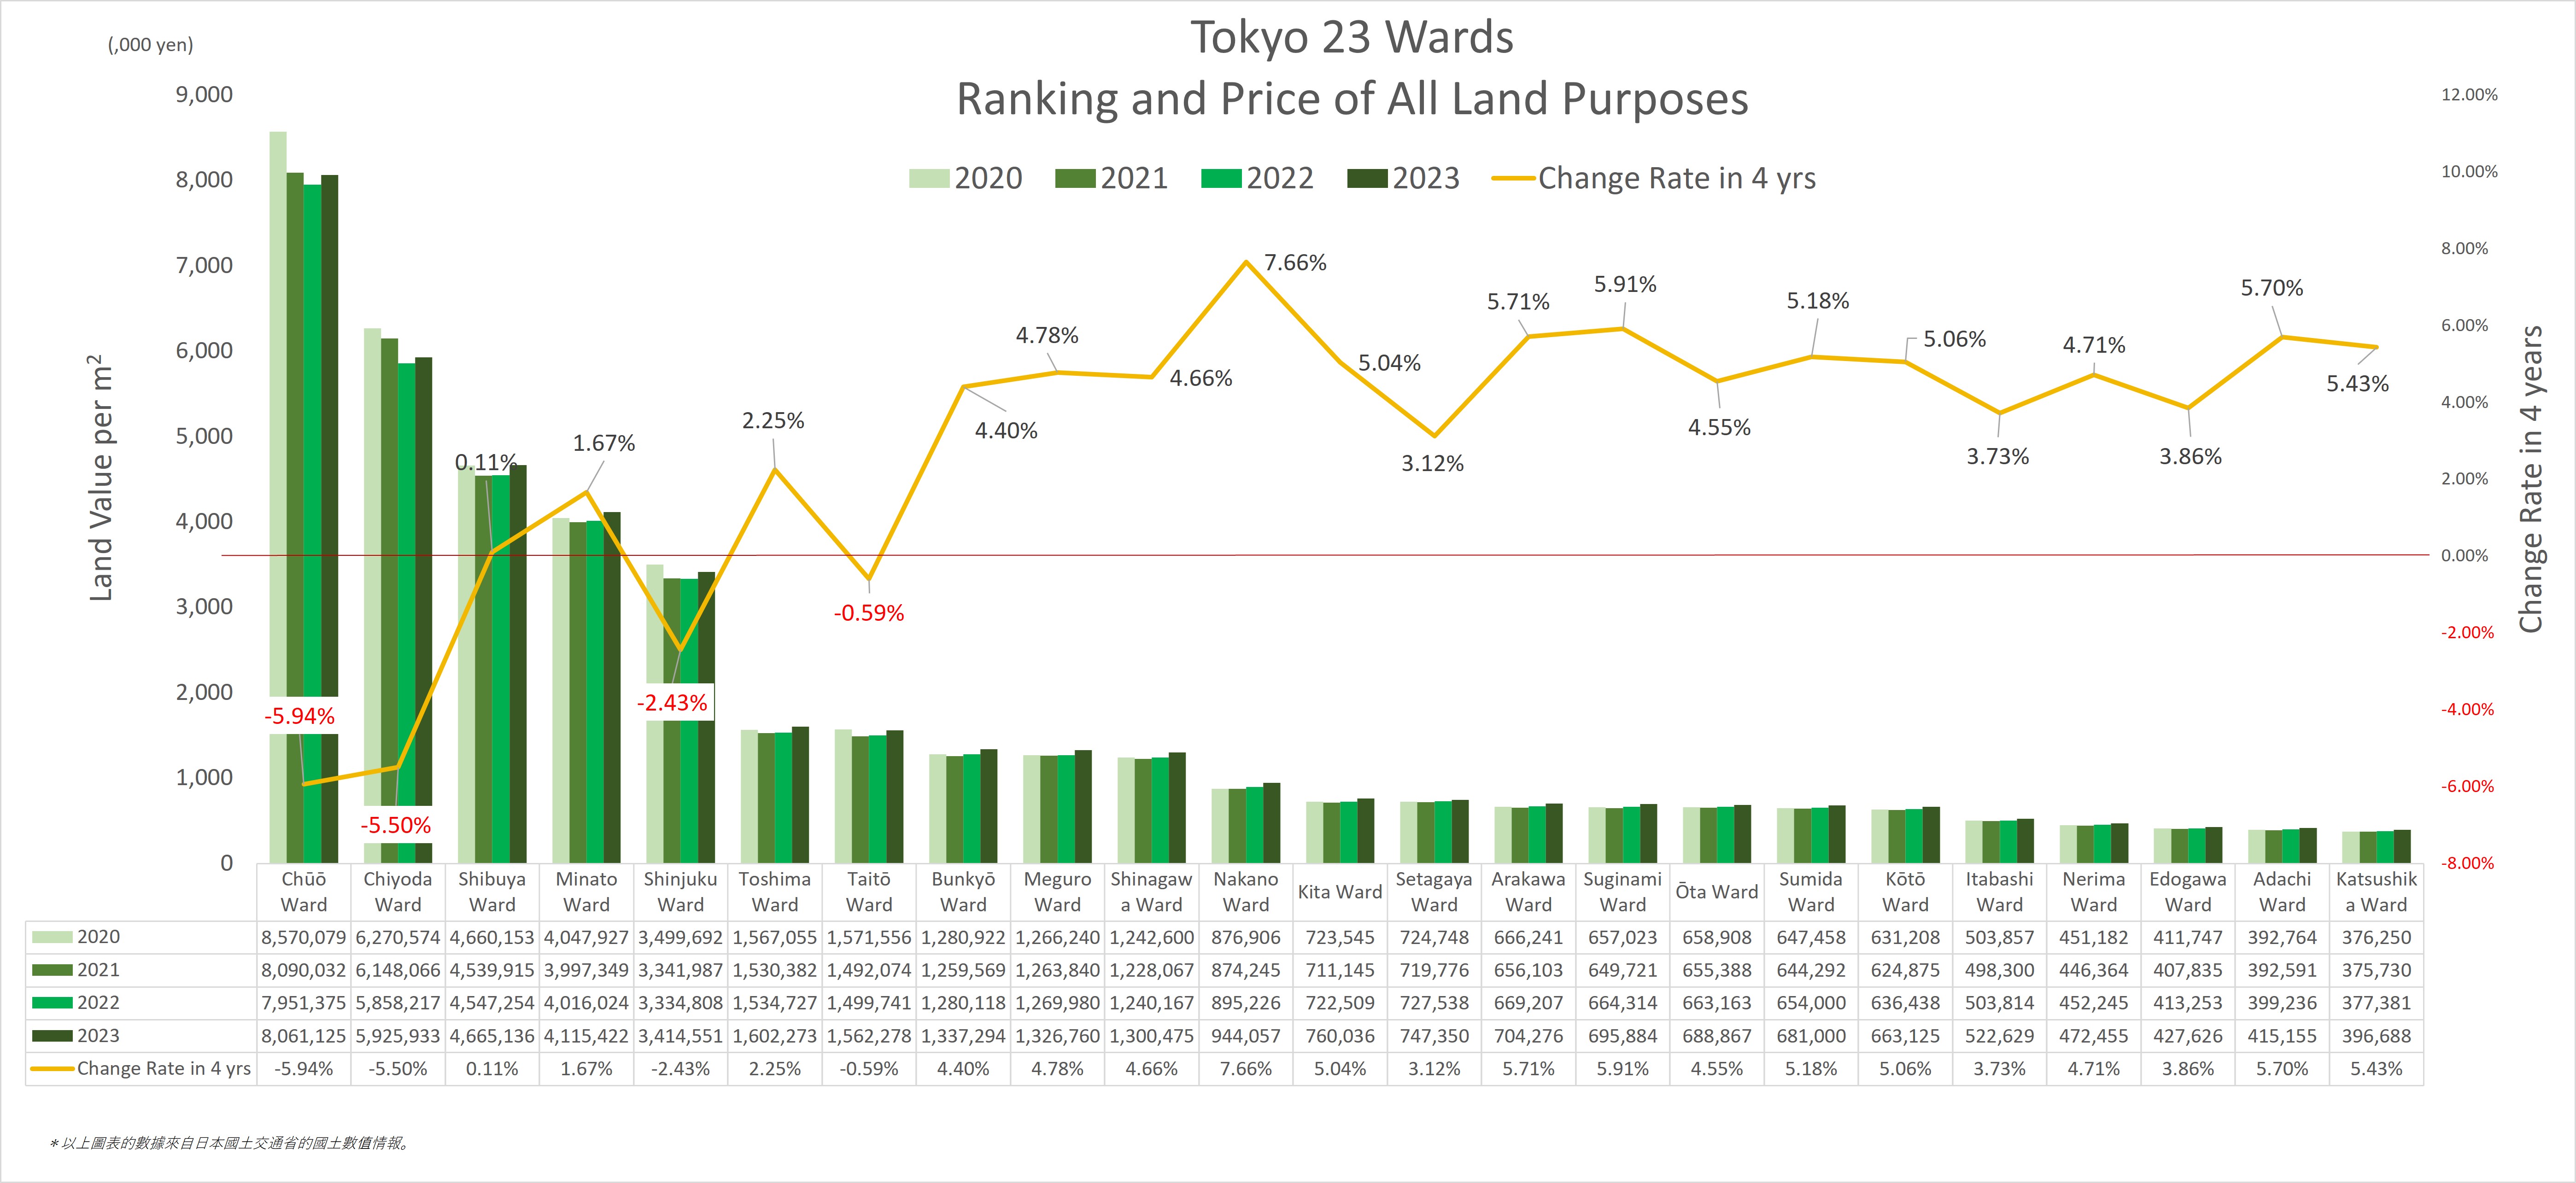
In this part, it will be focused on the analysis of the changes in land prices for commercial and residential use in each ward of the Tokyo 23 wards from 2020 to 2023. First, there will be an overall view on the average price (per square meter) and fluctuations of all land purposes in the 23 wards in 2023.
Among the average price of land in the Tokyo 23 wards, the top three in 2023 are Chuo Ward (8,061,125 yen), Chiyoda Ward (5,925,933 yen), and Shibuya Ward (4,665,136 yen). However, it is discovered that there are 4 wards whose price ranked in top 10 have recorded negative growth during the past 4 years. They include the top-ranked Chuo Ward, the second-ranked Chiyoda Ward, the fifth-ranked Shinjuku Ward, and the seventh-ranked Taito Ward.
The remaining 19 wards have positive growth in the past 4 years which indicating that the economic situation of most areas in 23 wards have been recovered. The ward with the highest growth rate is Nakano Ward, with land prices increasing from 876,906 yen in 2020 to 944,057 yen in 2023, recorded an increase of 7.66%. Suginami Ward ranks as the second, with a growth rate of 5.91% and the land price increased from 657,023 in 2020 to 695,884 yen in 2023.
*Please click the graphic for enlargement.
After reviewing the overall price change of all land purposes on 23 wards in Tokyo, a closer look will be made on the price changes for both residential and commercial land.
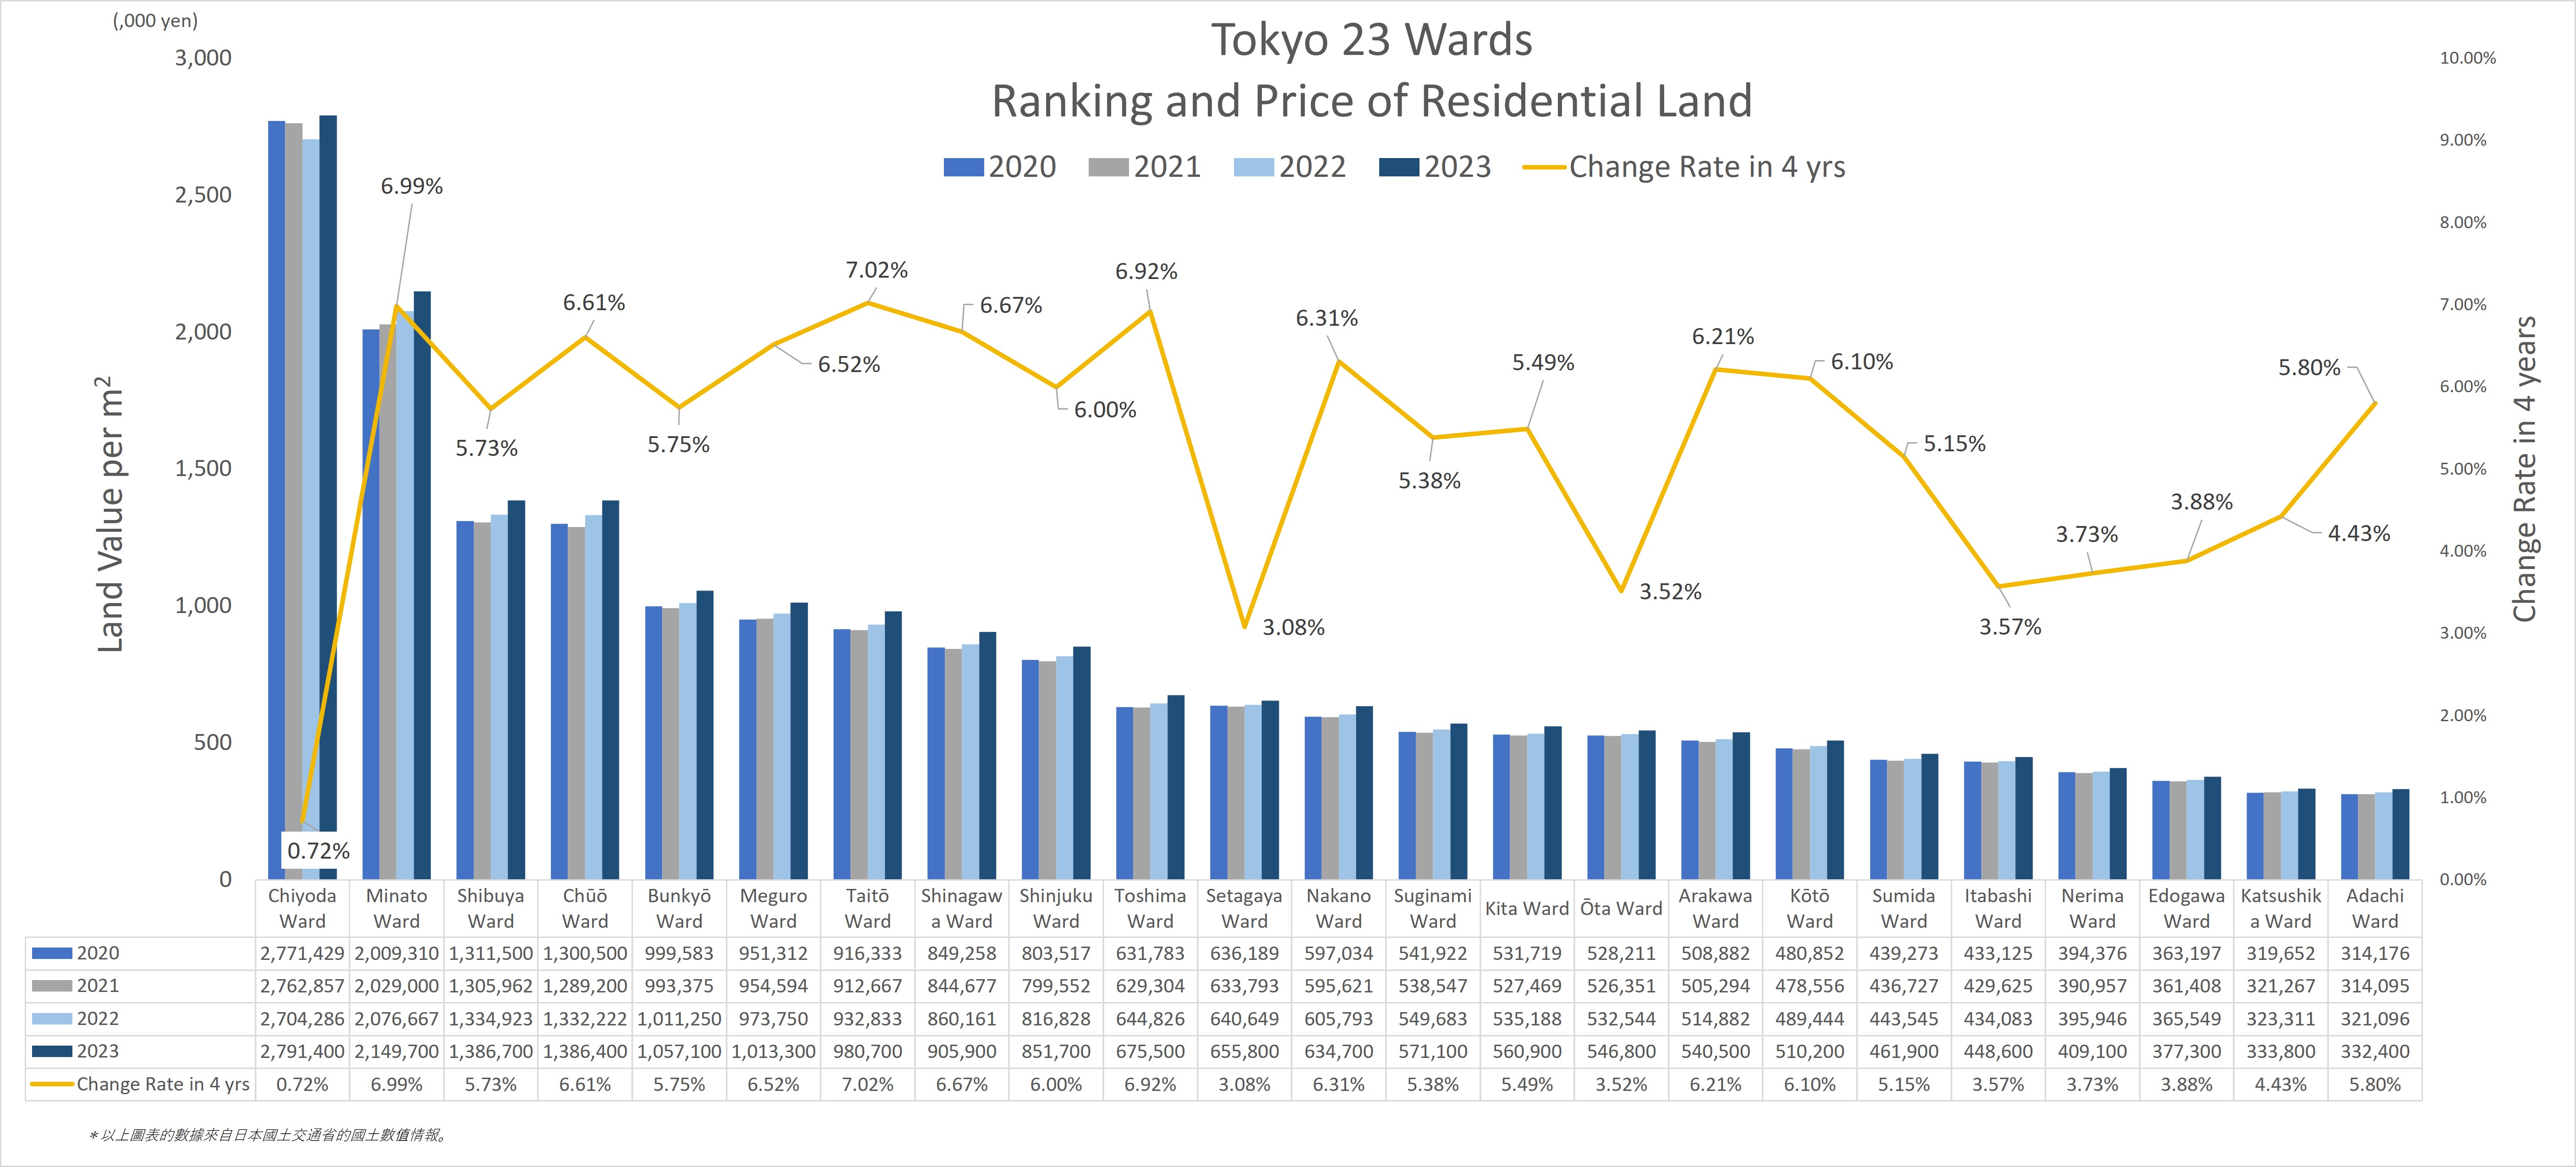
For residential land, all 23 wards recorded positive growth in the past 4 years. This discloses that the change of residential land price is not the reason contributed to the negative growth observed in the overall land prices in 23 wards. The three wards topped the highest average residential land prices are Chiyoda Ward (2,791,400 yen), Minato Ward (2,149,700 yen), Shibuya Ward (1,386,700 yen). Besides, the ward with the highest growth is the Minato Ward, with a growth rate of 6.99%, its land prices increased from 2,009,310 yen in 2020 to 2,149,700 yen in 2023. The second goes to Toshima Ward, with an increase of 6.92%, its land price changed from 631,783 yen in 2020 to 675,500 yen in 2023. Although Chiyoda Ward topped the residential price in 23 wards, its land price increased 0.72% only, which indicating that its price may have reached its peak.
*Please click the graphic for enlargement.
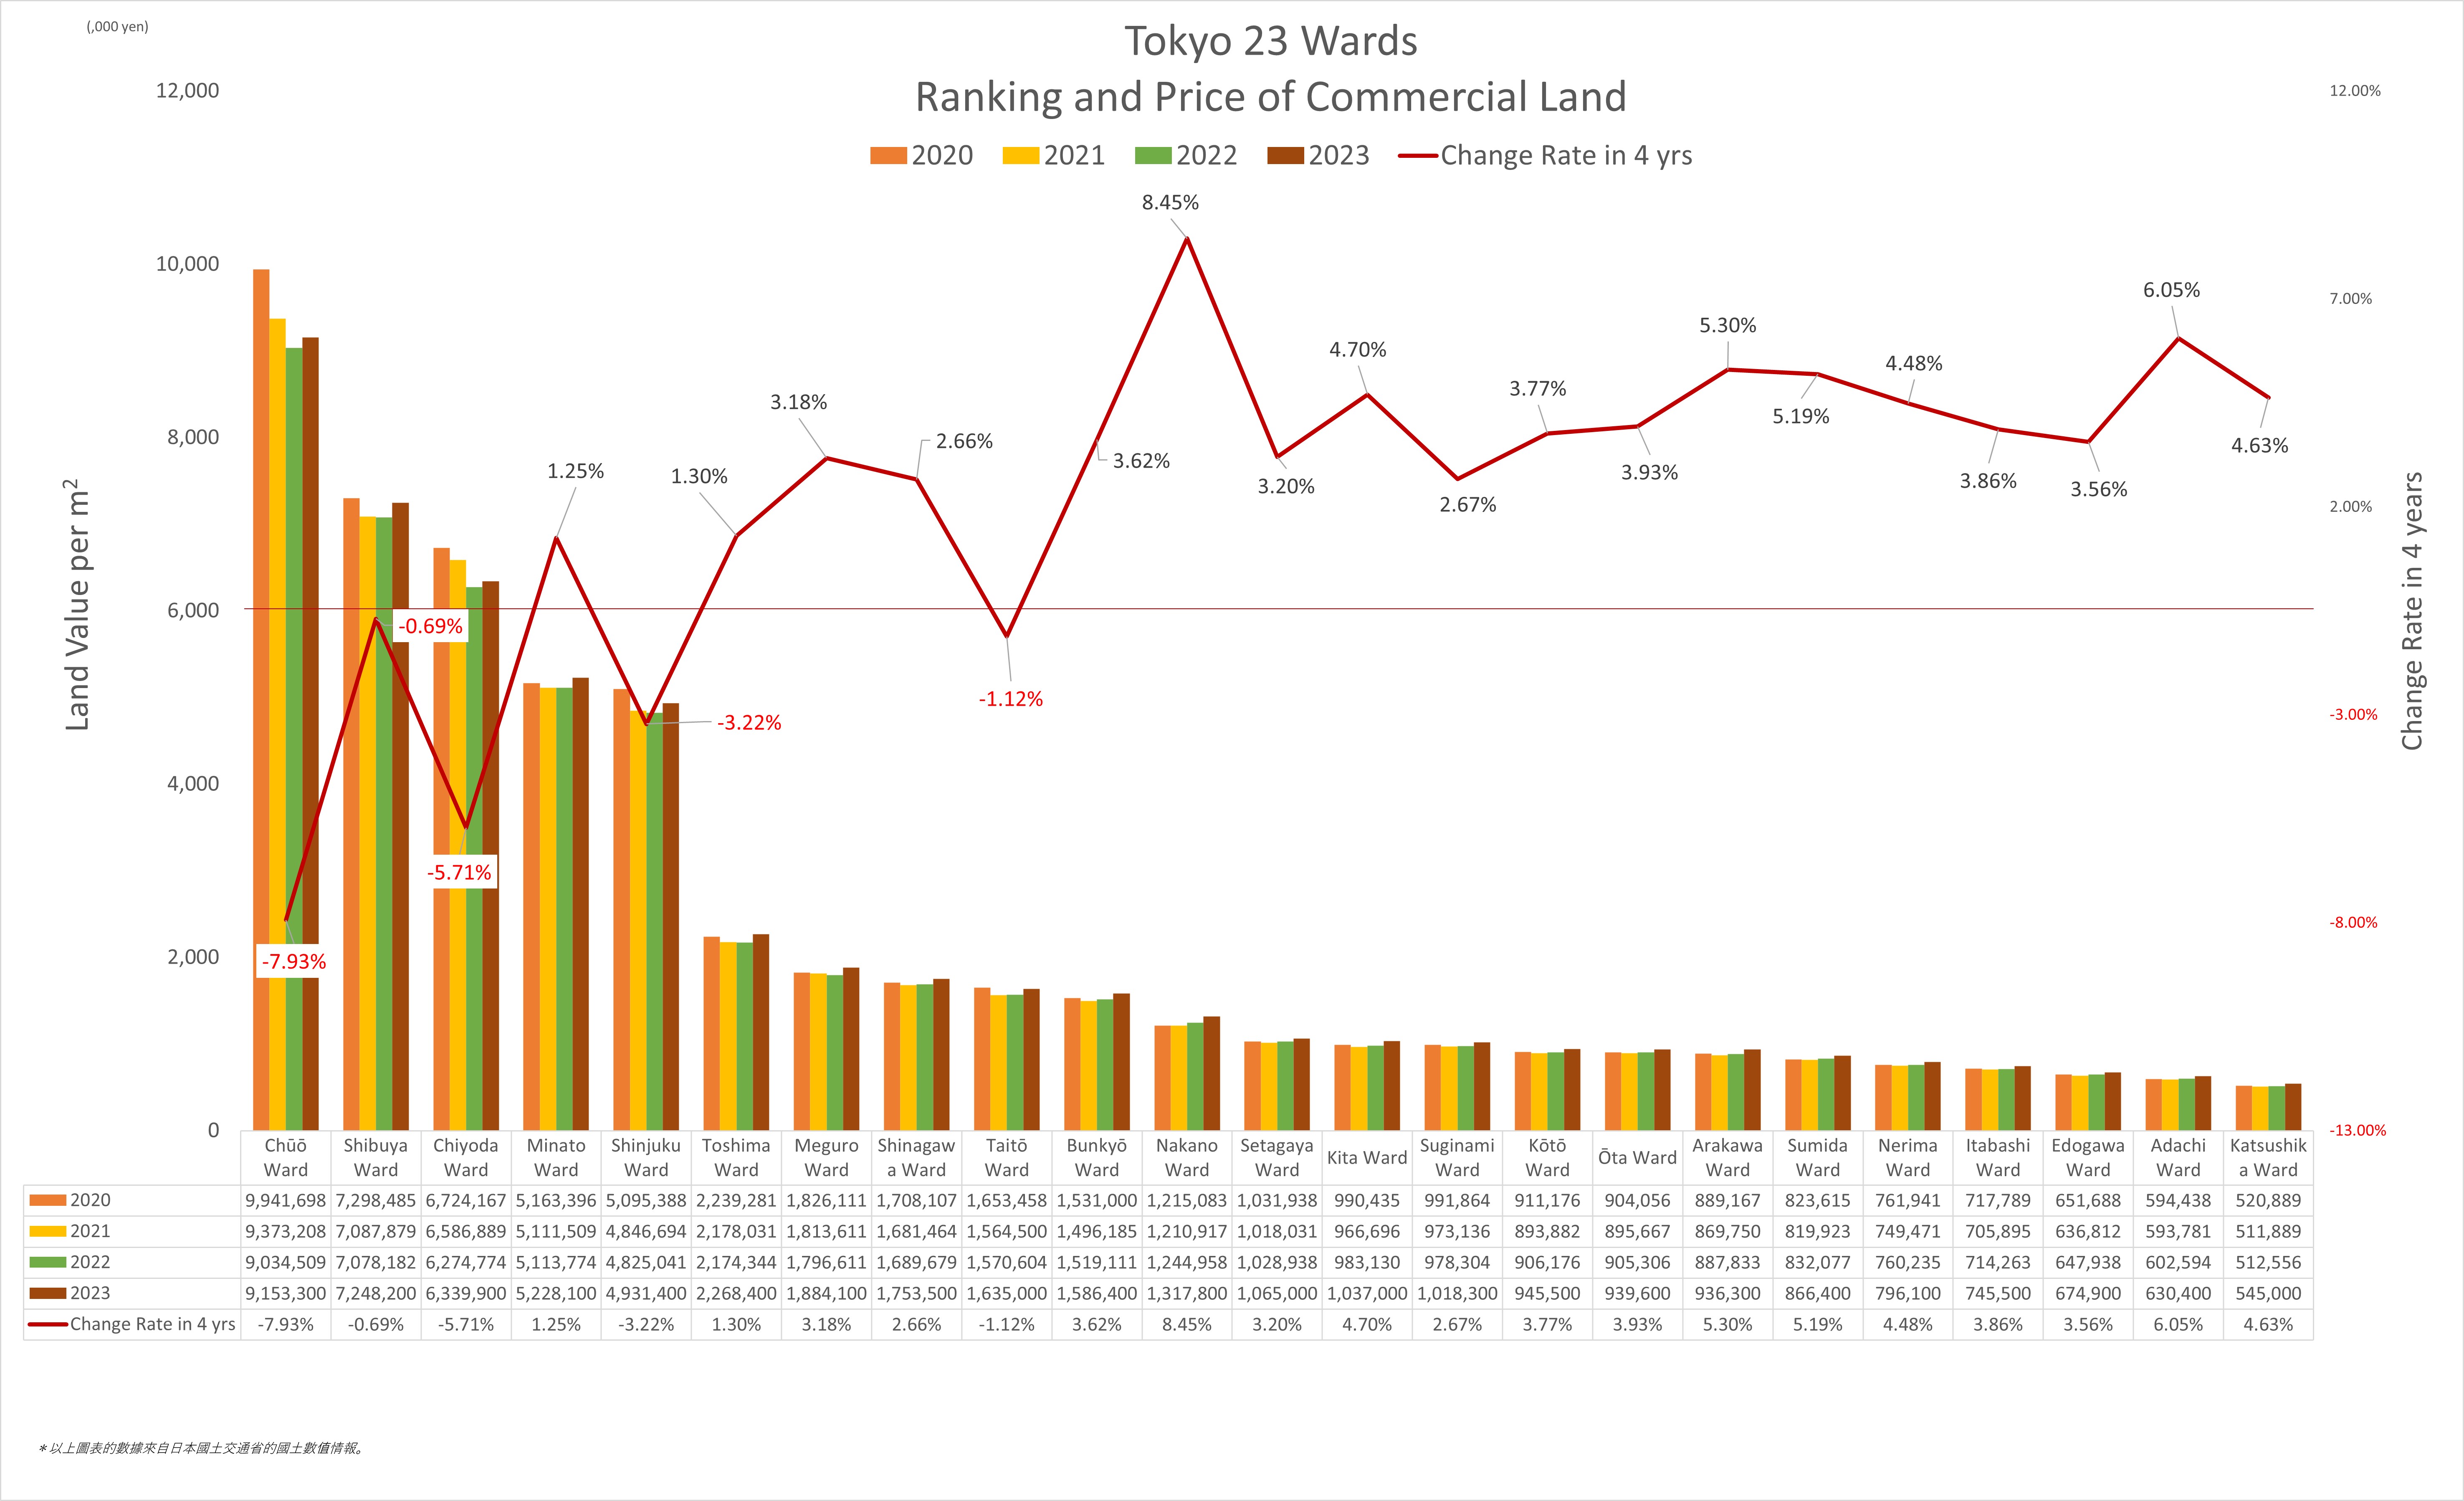
For commercial land, 5 out of the 23 wards recorded negative growth in land price during the pre- and post-pandemic periods, with one of them dropped 7.93%. This reflects the fact that the change of commercial land price is the main reason for the negative growth of overall land price in 23 wards.
The top 3 wards with the highest commercial land price are Chuo Ward (9,153,300 yen), Shibuya Ward (7,248,200 yen), and Chiyoda Ward (6,339,900 yen). This ranking has remained the same for several years, implying that other wards are still hard to catch up the land prices with these 3 wards. Even though, these 3 wards districts are experiencing negative growth. This might indicate that the land price of these 3 wards have already reached a level that investors cannot afford but forced to seek other alternatives. Other than these three wards, Shinjuku Ward and Taito Ward also recorded a negative growth rate of 3.22% and 1.12% respectively. ,
The ward with the highest growth rate is Nakano Ward. Its land price rising from 1,215,083 yen in 2020 to 1,317,800 yen in 2023, achieved a high growth rate of 8.45%. Unexpectedly, the second goes to Adachi Ward, which is located on the north-east side of 23 wards. Although its land price ranks 22nd among the 23 districts, its growth rate of 6.05%. This might hint that its potential on land price in the future could not be overlooked.
*Please click the graphic for enlargement.
■ SUMMARY
During the COVID-19 pandemic period, there might have been a transitory negative impact on land prices in Japan, causing a shift from positive growth in 2020 to a comprehensive decline in 2021. However, with the gradual improvement of the situation over the past two years and the reopening of borders to overseas tourists since the end of last year, and the full relaxation of borders in May of this year, the economic situation has gradually recovered.
According to the land price report released by the Ministry of Land, Infrastructure, Transport, and Tourism, land prices in Japan have continued to rise in the past two years, recording a year-on-year growth of 1.6% in 2023. Both residential land and commercial land have enjoyed growth rates of 1.4% and 1.8%, respectively, which are more than three times that of 2022.
The overall increase in land prices in the Tokyo district area, which consists of the Tokyo capital and three surrounding prefectures (Chiba Prefecture, Saitama Prefecture, and Kanagawa Prefecture), has a growth rate of 2.4%, which is also three times higher than that of 2022. The land prices of both residential and commercial land have experienced growth rates of 2.2% and 3%, respectively.
In addition, the 23 wards in the central area of Tokyo have also experienced a 3.4% increase in land prices in 2023, which is 1.9% higher than the previous year. Chiyoda Ward topped the residential land price at 2,791,400 yen per square meter, while Chuo Ward ranked first in the price of commercial land at 9,153,300 yen per square meter.
The continuous increase in residential land prices in the Tokyo district might be due to sustained high housing demand in areas that are convenient for living and transportation. On the other hand, with the government's tourism opening policy and ongoing redevelopment projects in some regions, the increasing demand for commercial land to accommodate commercial complexes and shops might be another reason driving up the commercial land prices.
In 2023, the overall land prices in most areas of Japan have recovered to pre-pandemic levels and show a trend of further increase. The continuous rise in land prices in Japan might arouse the interest of domestic and foreign property investors. Coupled with the depreciation of the Japanese yen, it may be a good time for overseas investors to consider investing in Japan's real estate market.
※Source: All the above tables and graphics are generated from the data of the Ministry of Land, Infrastructure, Transport and Tourism, Japan.
If you would like to learn more about property investment in Japan, please click here. >
You might have interest to read the following articles as well:
○ 2022 Tokyo Autumn Leaves | 10 Fantastic Fall Foliage Sceneries in Tokyo
○ A guide for foreigners buying real estate in Japan.
○ What is the most updated land value in Tokyo and the changes in 5 years ?
○ NEW OR OLD? Which one is better for property investment in Japan?
○ What are the costs incurred when buying a property in Japan?.
○ What is 1R, 1K, 1DK and 1LDK?
(REF: B-MN-E01